Season Visualizations
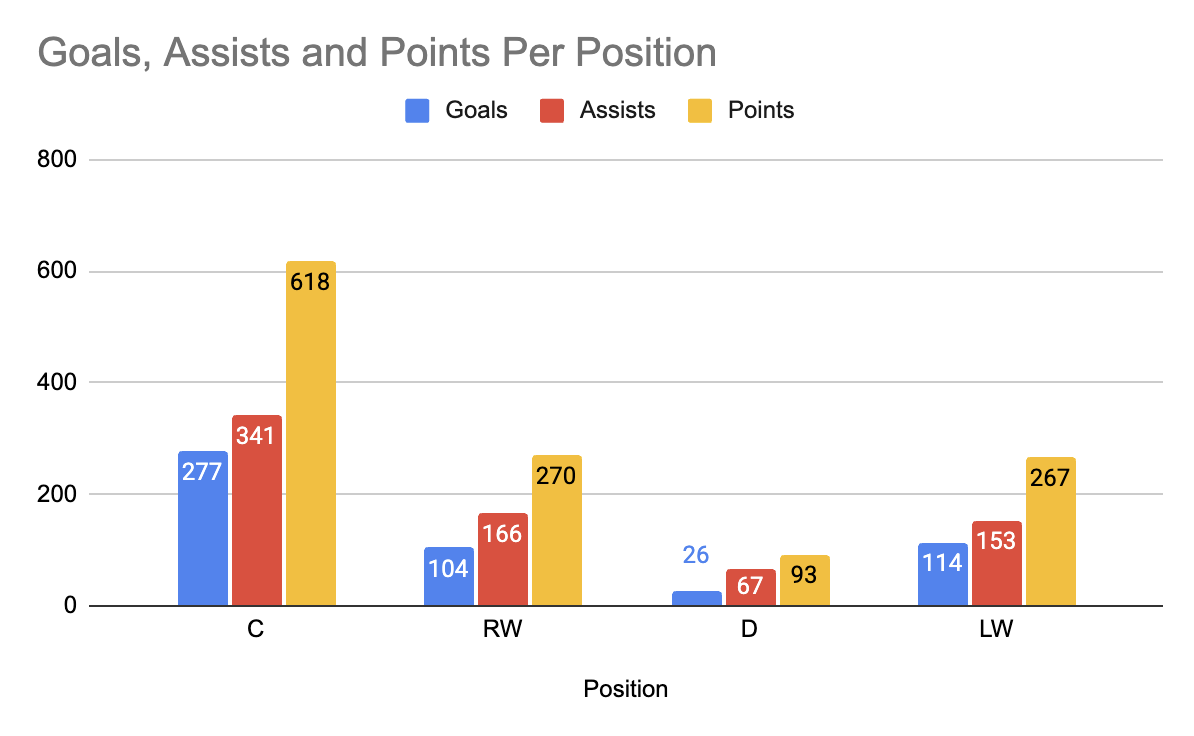
Figure 1. Goals, Assists, and Points broken down by player position (C, RW, D, LW).
Centers dominate every offensive category by a wide margin — recording 277 goals, 341 assists, and 618 total points, more than double any other position. This is not surprising given that centers control zone entries, take most faceoffs, and are typically a team's primary playmakers. Right Wings rank second with 270 points, closely followed by Left Wings at 267, suggesting both wing positions contribute roughly equally to scoring. Defensemen trail significantly with just 93 points, which reflects their primary role as defensive players, though their assist totals (67) show they do contribute offensively through zone exits and power-play quarterback roles. This chart makes a strong argument that when building a roster, investing in elite centers is the highest-value offensive decision a team can make.
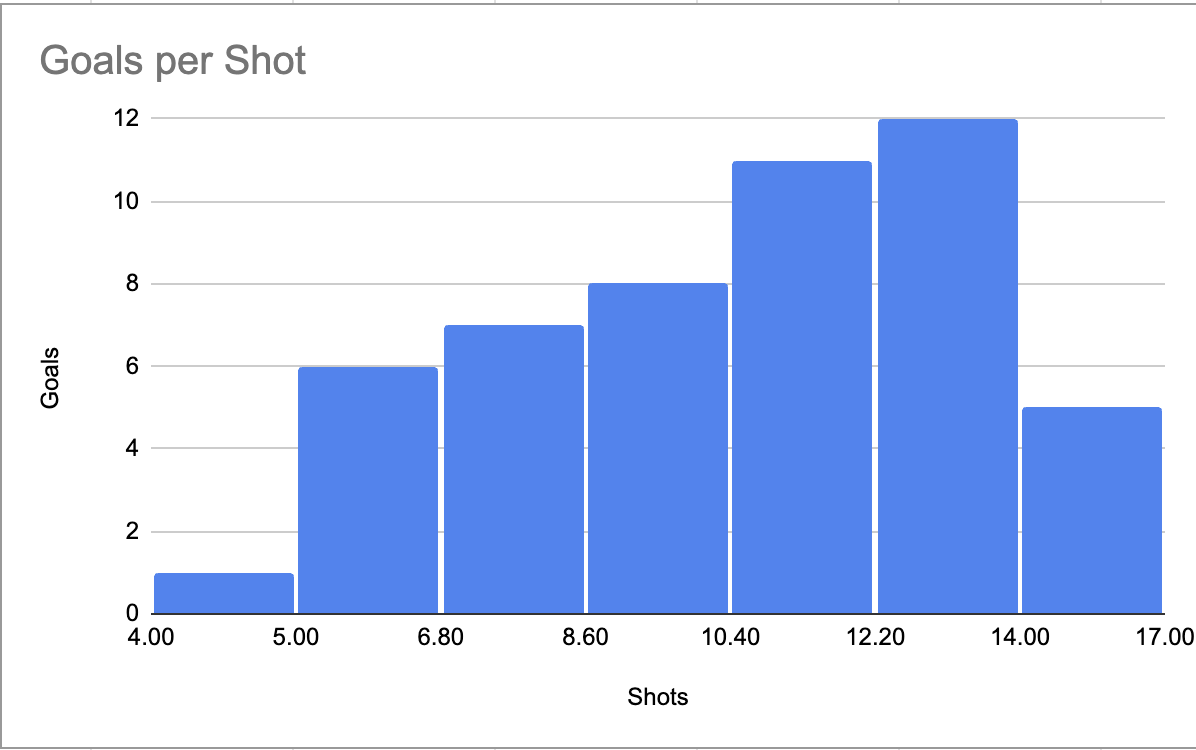
Figure 2. Distribution of goals scored grouped by shots taken — showing shooting efficiency.
There is a clear and consistent positive relationship between shot volume and goal production — players who shoot more, score more. The distribution rises steadily from just 1 goal at 4 shots all the way to a peak of 12 goals at 12.2 shots per game, before slightly declining at the highest shot volumes. This dip at 14–17 shots may indicate that extremely high shot counts include lower-quality attempts from bad angles or heavy traffic, slightly reducing conversion rates. The key insight here is that encouraging players to shoot more frequently — rather than always looking for the "perfect" opportunity — directly translates into more goals. Coaches and analysts should prioritize shot generation as a core offensive strategy, as volume shooting is strongly correlated with scoring output.
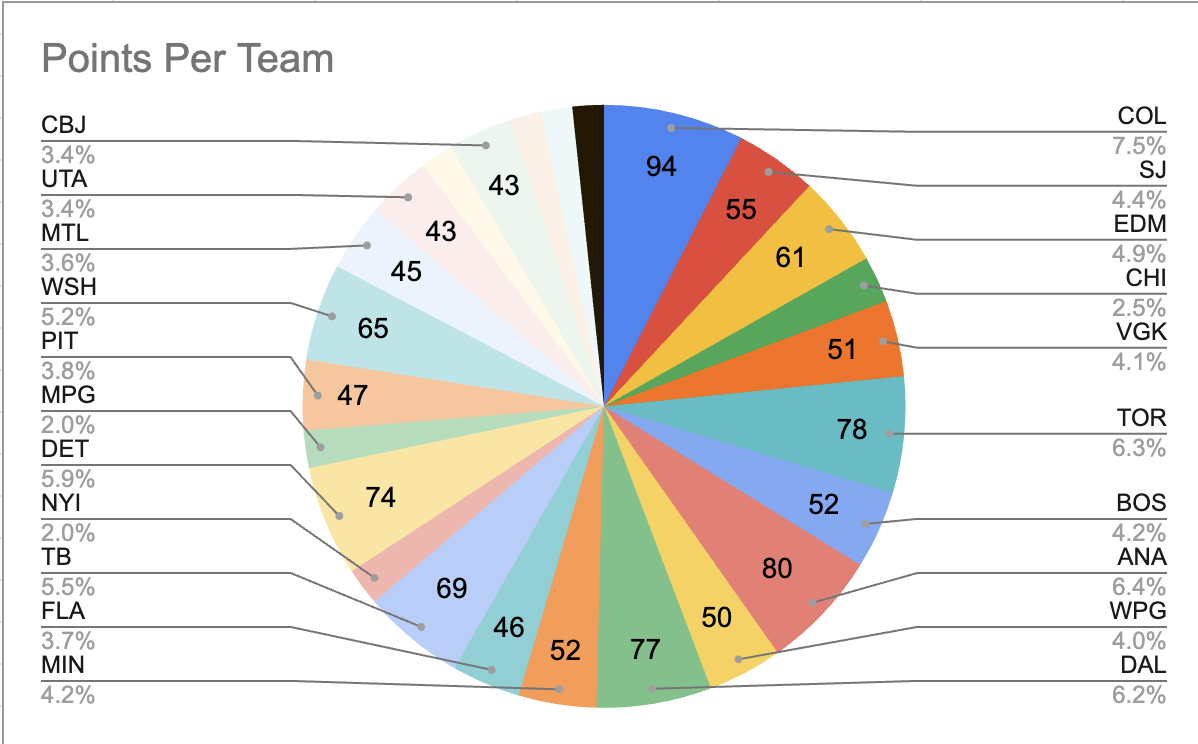
Figure 3. Total points share per NHL team, showing each franchise's offensive contribution.
The Points Per Team pie chart reveals that offensive production is surprisingly well distributed across the league — no single franchise dominates the scoring landscape. Colorado (COL) leads with 7.5% of total points, followed by Toronto (TOR) at 6.3% and Winnipeg (WPG) at 6.2%, indicating these teams field the deepest and most productive offensive rosters. At the other end, teams like Detroit (DET) and Tampa Bay (TB) each account for just 2.0% of total points, highlighting significant offensive underperformance. The relatively even spread across most franchises suggests that NHL parity mechanisms — like the salary cap — are functioning effectively, preventing any one team from monopolizing offensive talent. However, the gap between top and bottom teams is still meaningful, and these disparities closely mirror each team's playoff success during the season.